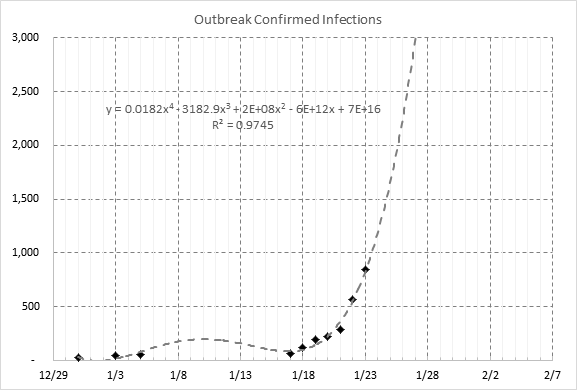
Common infectious disease studies for disease spread pace and infection rates among population rely heavily on fitting predetermined epidemic formulas, which in reality resembles nothing how flu virus actually spread. Here I propose a stochastic simulation model that mimic the actual virus spreading mechanism among people, see the model diagram below.
STOCHASTIC VIRUS SPREADING model
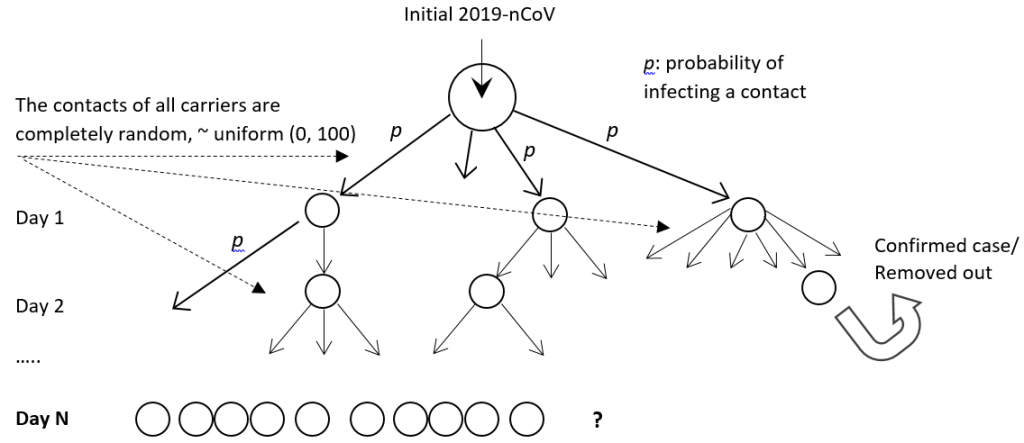
In this stochastic simulation model, we to mimic the actual virus spreading mechanism through computer simulations of how virus are passed from people to people and how people may or may not develop symptom and therefore passes virus to more people the second day. For those developed symptom will be removed out of the spreading chain. We randomly chosen based on a probability distribution the following:
(1) The number of people a virus carrier might meet each day,
(2) The number of contracted patient would develop symptoms, and
(3) Who with confirmed contraction would be quarantined from the population.
Samples are drawn on daily bases, and are drawn based on defined probabilities. This is different from fitting a deterministic model afterward in most published epidermic studies today, and are much closer reflecting how actually the virus spread in real life.