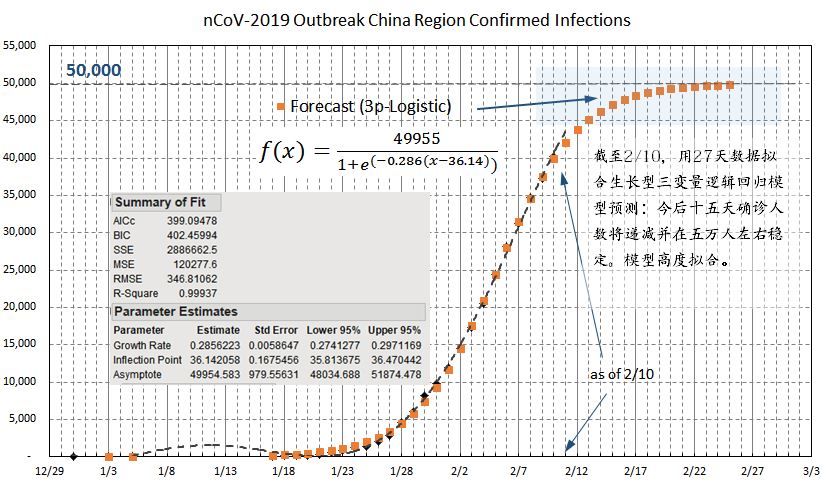
The pattern is getting clearer. With my 3-parameter logistic growth model fits as of February 10, 2020, the total confirmed cases will stabilize around 50,000 cases. The model came with a 0.9994 R-square.
Such a near-perfect model-fitting with 27 data points is not surprising. China’s enormous national effort to collect the patient data enables results in high-quality data, which approximates very closely many natural growth patterns.
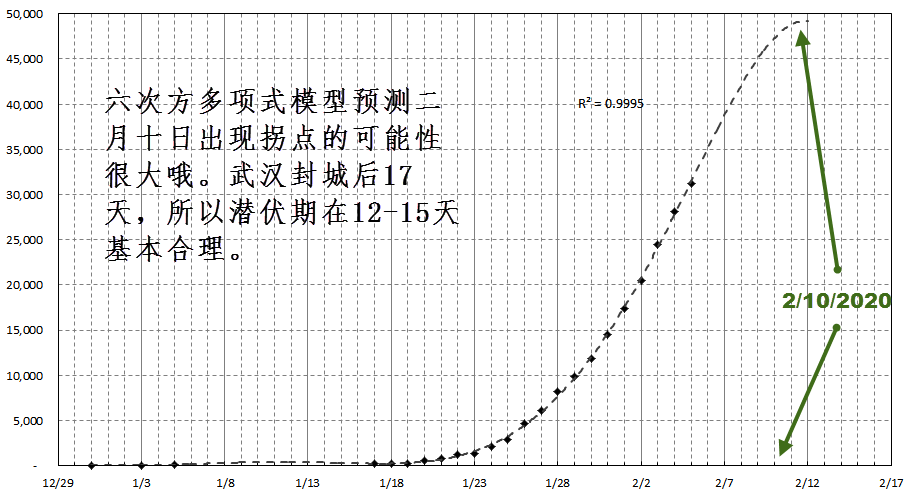
With the latest confirmed 2019-nCoV infections on Feb. 7, 2020, the time when new confirmed cases will stop emerging. As indicated in the forecast shown below based on a simple order-6 polynomial model on confirmed cases using data since official data release December 29, 2019.
The significance of this prediction potentially confirms the actual virus incubation period among humans. Most experts have estimated it to be somewhere between 12-15 days. If the Feb. 10 or a few days after turns out to be the date no more significant new confirmed cases, then this estimate is then reasonable, as China started sealing off Wuhan then cutting off essentially all people-to-people form of transfers 17 days prior to the estimated Feb. 10. It also supports the fact no new form of the virus is causing similar infections.
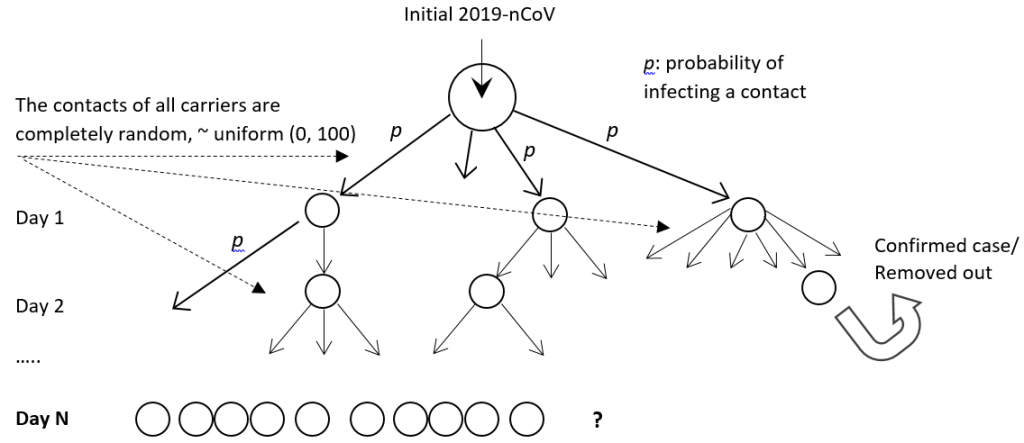
Common infectious disease studies for disease spread pace and infection rates among population rely heavily on fitting predetermined epidemic formulas, which in reality resembles nothing how flu virus actually spread. Here I propose a stochastic simulation model that mimic the actual virus spreading mechanism among people, see the model diagram below.
STOCHASTIC VIRUS SPREADING model
In this stochastic simulation model, we to mimic the actual virus spreading mechanism through computer simulations of how virus are passed from people to people and how people may or may not develop symptom and therefore passes virus to more people the second day. For those developed symptom will be removed out of the spreading chain. We randomly chosen based on a probability distribution the following:
(1) The number of people a virus carrier might meet each day, (2) The number of contracted patient would develop symptoms, and (3) Who with confirmed contraction would be quarantined from the population.
Samples are drawn on daily bases, and are drawn based on defined probabilities. This is different from fitting a deterministic model afterward in most published epidermic studies today, and are much closer reflecting how actually the virus spread in real life.
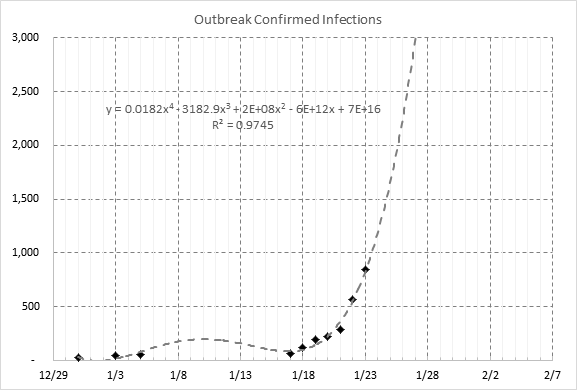
Forecasts are made based on live daily confirmation case data from the Chinese government since 1/31/2019. The case developing trend and case forecast for the next few days are shown in the graph below. The forecast line indicates the center of future data points, with a small variation.
Forecast for confirmed cases for the next few days are: