Logistic Growth Curve Forecasts a Receding Trend of Confirmed Cases and a Total Stabilization around 50,000 near February 20th

The pattern is getting clearer. With my 3-parameter logistic growth model fits as of February 10, 2020, the total confirmed cases will stabilize around 50,000 cases. The model came with a 0.9994 R-square.

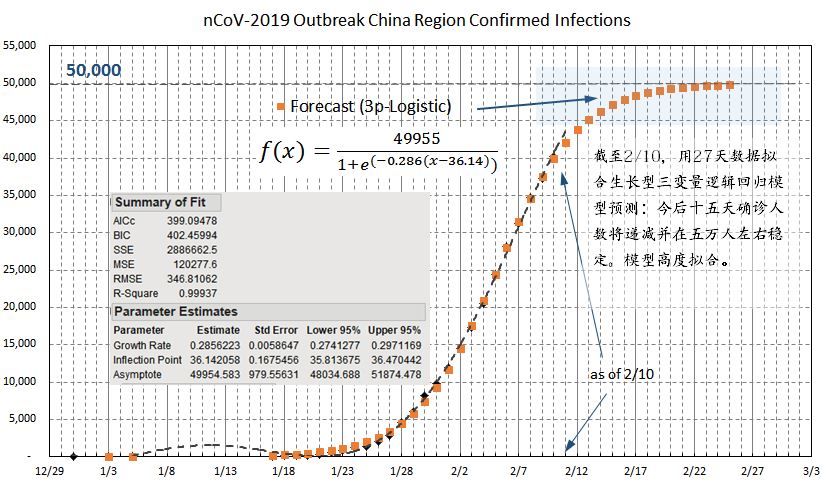
Such a near-perfect model-fitting with 27 data points is not surprising. China’s enormous national effort to collect the patient data enables results in high-quality data, which approximates very closely many natural growth patterns.

Dawn of the Battle Against 2019-nCoV Emerges

With the latest confirmed 2019-nCoV infections on Feb. 7, 2020, the time when new confirmed cases will stop emerging. As indicated in the forecast shown below based on a simple order-6 polynomial model on confirmed cases using data since official data release December 29, 2019.

The significance of this prediction potentially confirms the actual virus incubation period among humans. Most experts have estimated it to be somewhere between 12-15 days. If the Feb. 10 or a few days after turns out to be the date no more significant new confirmed cases, then this estimate is then reasonable, as China started sealing off Wuhan then cutting off essentially all people-to-people form of transfers 17 days prior to the estimated Feb. 10. It also supports the fact no new form of the virus is causing similar infections.