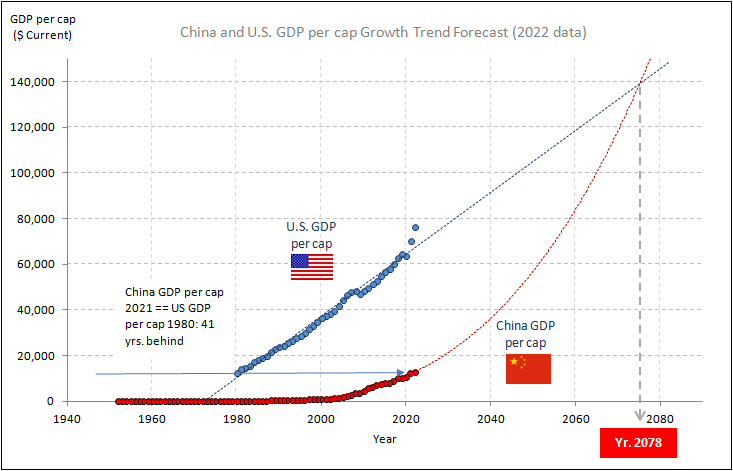
As of 2022, China’s GDP per capita is $12,814 vs. the US $76,348.49, or only about 1/6 of the US value. China’s GDP per capita in 2022 is about US’ level in 1981, or 41 years behind. Based on the growth trends during the past 18 years, it will take China until 2078 to reach the US level, or about 55 years from now. See the growth forecast in the Chart below
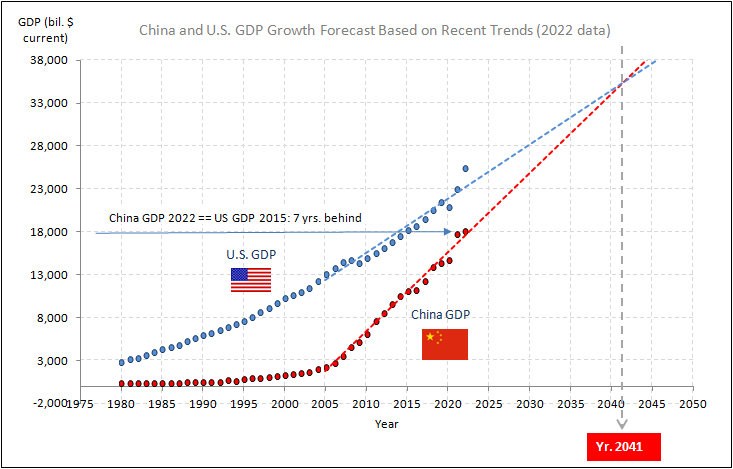
China’s total GDP in 2022 is $18,100 bil., vs. US’ $25,460 bil., or about the US level in 2015. China is 7 years behind the US. Based on the current GDP growth of both countries since 2005, China will catch the US in about 2041, or 19 years from 2022. All dollar figures are based on current value. See the forecast growth trends in the chart below.
Of course, the forecasts assume the future world economic outlook, trade, and the two countries’ social conditions for the years to come to stay relatively comparable in the years between 2005-2022, and between 1980-2022 for the per-cap GDP forecast. Disruptive geo-political events are likely to invalidate the forecasts in either direction in short term, as many developed countries worked hard to stop the frightful world power shift. Nevertheless, the general demand for better living standards from the vast number of developing countries will ultimately drive world growth in the long run. China as one of the poor developing countries equipped with outstanding learning skills will enjoy abundant catch-up work, by gradually improving their production means. The per-capita economic gap China posts with the US may not mend soon, and it is exactly what will drive the race between China and US for hundreds of years to come.
(Data are compiled by Researchnology Economic Research©. Researchnology Co. will update these forecasts annually)