Test Posting on WordPress

Publish R Markdown Document on WordPress

It is possible to write R Markedown then publish it on a web site in WordPress. WordPress is a software that manage the interraction between web visitors and the web server. It functions analogous to Php. Website owner do not need to know Php in order to have a website running. The Rmarkdown package posts raw Rmarkdown files to WordPress software directly by running a R files within RStudio. Running this code after saving the “post.RMD” in the same directory,

options(WordPressLogin=c(your_own_user_name='your_password'),
        WordPressURL='https://yourwordpressaddress.com/xmlrpc.php')

knit2wp(input='post.RMD', title = 'RWordPress Package',post=FALSE,action = "newPost")

This uploads the .Rmd file “post.RMD”. Next the website owner will need to log into the admin page of the WP site, click this file, then push the Publish button to publish the document.

After publication the owner will use “post id” to update this post. The post id can be found in the edit article URL. Once you are in the post editor, view the post's URL in your web browser's address bar to find the ID number. For example, the URL for this post is

http://researchnology.com/wp-admin/post.php?post=378&action=edit

here the post id is “378”. To post an edit of ths document, issue this command in R

knit2wp(input='post.RMD', title = 'RWordPress Package',post=FALSE,action = "editPost",postid=378)

That's all to it. The Rworldpress package is not actively maintained as of Dec. 21, 2021. So if WordPress makes any change in the future, the above steps may fail. R package “blogdown” was said to have some functions similar to Rwordpress. Let's check it out.

Note this article itself is an R Markdown document. For more details on using R Markdown see http://rmarkdown.rstudio.com. You can embed an R code chunk like this:

summary(cars)
##      speed           dist       
##  Min.   : 4.0   Min.   :  2.00  
##  1st Qu.:12.0   1st Qu.: 26.00  
##  Median :15.0   Median : 36.00  
##  Mean   :15.4   Mean   : 42.98  
##  3rd Qu.:19.0   3rd Qu.: 56.00  
##  Max.   :25.0   Max.   :120.00

Including Plots

You can also embed plots, for example:

plot of chunk pressure

Note that the echo = FALSE parameter was added to the code chunk to prevent printing of the R code that generated the plot.

Gaining Knowledge Through Data Partition – Decision Trees, Bootstrap Forests and Boosted Trees

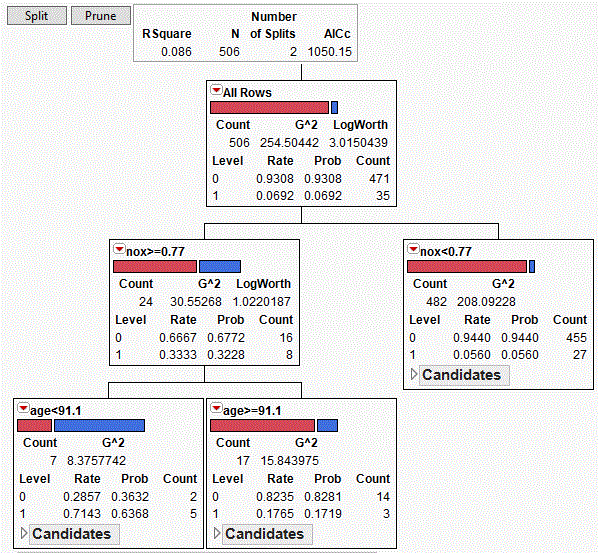
Decision trees may be called “classification tree” when the response is categorical, and “regression tree” when the response is continuous. The partitions are made to maximize the the distance between the proportions of the split groups with a response characteristic for classification tree, and to max. the difference of the means of the split groups for regression trees. Decision trees are user friendly and computer intensive methods therefore are well received with growing software popularity.  The methods help users

  • Determine which factors impact the variability of a response,
  • Split the data to maximize dissimilarity or the two split groups,
  • Describe the potential cause-and-consequence relationships between variables
Decision trees split samples to maximize dissimilarity sequentially until no additional knowledge is gained.

Tree-based models avoids specifying model structure, such as the interaction terms, quadratic terms, variable transformations, or link functions etc. needed in linear modelling (though may be removed upon fitting the linear model model). It can also screen a large number, say hundreds of variables (linear models can use main effects to do the same, but may be error prone with too any variables) fairy quickly. It is user-friendly that computer does all the intensive computation, with minimal involvement of user knowledge in statistical theory (as in linear modelling).

Bootstrap forest (aka. Random forest) and boosted trees (aka. Gradient-boosted trees) are two major types of tree-based methods. Bootstrap forest estimates are averages of all tree estimates based on individual bootstrap samples (the “trees”). This averaging process is also know as “bagging”. Also the number of bootstrap samples, the sampling rate, the model which including the max. number of splits and the min. obs/node etc. are pre-specified.

On the other hand, boosted trees are layers of small trees built one-on-top-of-the-other, with smaller trees structured to fit the residuals from the top level tree. The overall fit improves as the residuals are minimized by adding smaller trees to fit the last model residuals. Both bootstrap forest and boosted tree methods may not be visualized directly, as these a complex tree structures. The most effective visual evaluation is through the model profiler available in software tools.

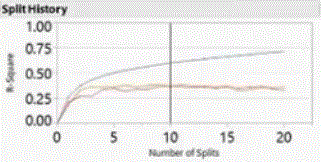
More data splitting results in better fit as measured by R-square. The graph below shows the increases in R-square in each splitting step, calculated separately on the training data (the top curve), the test data (orange) and the validations data (red):

improvement in R-square as the number of splits increases, but using the training data, the test data (orange) and the validations data (red)

At certain splitting step, the validation stops to improve, in this case, about the second or third step. The proportion of data select to use as validation data may affect the number of splits to be optimal, i.e., select 40% may ended with 3 splits to be the choice, vs. selecting 30% as validation that ended with 2 splits to be optimal (in other words, still an “art” not “science”)

Reviewing Concepts

The training and validation sets are used during training model. Once we finished training, then we may run multiple models against our test set and compare the accuracy between these models.

In some software tool, types of miss-classification may be controlled, by weighing the importance of Type I and Type II errors, specified as ratios in negative integers, larger the negativity, the more damage.

Research Term

“LogWorth”: the negative log of the p-value, the larger (or smaller the p-value, the more significance), the more it explains the variation in Y, is used to select among candidate variables the one split variable, and the value at which it splits the population. It is calculated as the negative log of the p-value

Application Example

May be used to select the most significant factor that separate workforce either by gender or race, i.e. job group, job function, geographic location, annual salary, bonus or job performance ratings.

Screen to a few among a large number of factors to use in design of experiment, to avoid the large number of expensive full or fractional experiment runs.

Though there are large number of variables may be used, only a few that will explain most of the variation in Y

(Modeling using JMP Partition, Bootstrap Forests and Boosted Trees)

Applications of Statistical Methods That Advance Commercial Activities

The meaning of “Advance” to commercial activities is equivalent to “Adding Value”, specially it is achieved through the following means:

  1. Higher profits from offering product or services. Higher profit is achieved through selling product or services at higher prices, this means finding the product or services can be sold at higher prices in general, or locating the customer segments who are willing to pay for it, or both.
  2. Lower cost in producing the product or services. Optimization of production or creation process may decrease costs in producing product or services. Optimization means better utilization of currently available resources, or finding alternative resources that cost less.
  3. Discovery of new product or services that usually afford higher profit margin in early market offering stage where competition is rare, therefore beat the traditional competition,
  4. Overcome road blocks in developing and maintaining products or services to meet contractual or bidding requirements,
  5. Improvements of government service expected by the public.

Major statistical applications mentioned below can add commercial or governmental organizations to achieve these goals, in a way that are faster, and may not even be possible using traditional administrative or make-believe approaches, that non-specialists tend to regard as effective. Persons promoting these approaches to future clients should fully understand the clients problem, and the advantages of the mentioned below methodology over traditional methods.

The story may be long, but here is a broad overview. More detailed scenarios, applications or novel solutions may be expanded in future posts.

—————————————————

Data Mining, Machine Learning and AI

Organizations that will benefit:

How it adds value:

Scenarios:


Statistical Modeling

Organizations that will benefit:

How it adds value:

Scenarios:


Survey Research

Organizations that will benefit:

How it adds value:

Scenarios:


Discovery Methods, Innovation and Manufacturing Improvements

Organizations that will benefit:

How it adds value:

Scenarios:


Quality Control, Statistical Process Control

Organizations that will benefit:

How it adds value:

Scenarios: