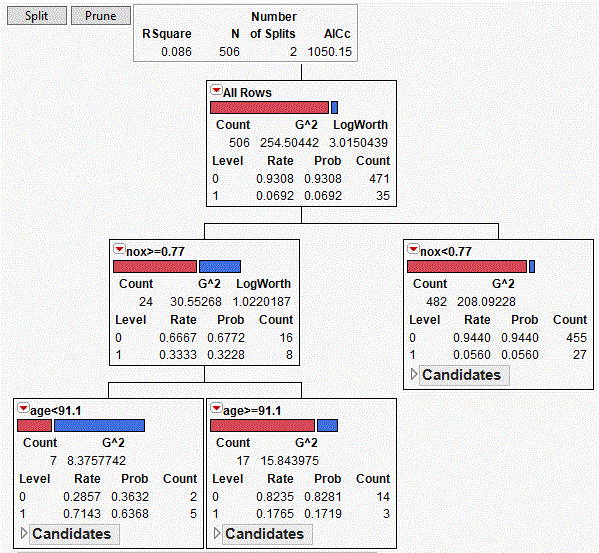
Decision trees may be called “classification tree” when the response is categorical, and “regression tree” when the response is continuous. The partitions are made to maximize the the distance between the proportions of the split groups with a response characteristic for classification tree, and to max. the difference of the means of the split groups for regression trees. Decision trees are user friendly and computer intensive methods therefore are well received with growing software popularity. The methods help users
- Determine which factors impact the variability of a response,
- Split the data to maximize dissimilarity or the two split groups,
- Describe the potential cause-and-consequence relationships between variables

Tree-based models avoids specifying model structure, such as the interaction terms, quadratic terms, variable transformations, or link functions etc. needed in linear modelling (though may be removed upon fitting the linear model model). It can also screen a large number, say hundreds of variables (linear models can use main effects to do the same, but may be error prone with too any variables) fairy quickly. It is user-friendly that computer does all the intensive computation, with minimal involvement of user knowledge in statistical theory (as in linear modelling).
Bootstrap forest (aka. Random forest) and boosted trees (aka. Gradient-boosted trees) are two major types of tree-based methods. Bootstrap forest estimates are averages of all tree estimates based on individual bootstrap samples (the “trees”). This averaging process is also know as “bagging”. Also the number of bootstrap samples, the sampling rate, the model which including the max. number of splits and the min. obs/node etc. are pre-specified.
On the other hand, boosted trees are layers of small trees built one-on-top-of-the-other, with smaller trees structured to fit the residuals from the top level tree. The overall fit improves as the residuals are minimized by adding smaller trees to fit the last model residuals. Both bootstrap forest and boosted tree methods may not be visualized directly, as these a complex tree structures. The most effective visual evaluation is through the model profiler available in software tools.
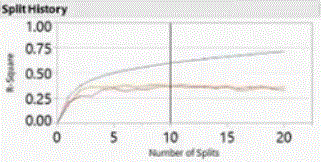
More data splitting results in better fit as measured by R-square. The graph below shows the increases in R-square in each splitting step, calculated separately on the training data (the top curve), the test data (orange) and the validations data (red):

At certain splitting step, the validation stops to improve, in this case, about the second or third step. The proportion of data select to use as validation data may affect the number of splits to be optimal, i.e., select 40% may ended with 3 splits to be the choice, vs. selecting 30% as validation that ended with 2 splits to be optimal (in other words, still an “art” not “science”)
Reviewing Concepts
The training and validation sets are used during training model. Once we finished training, then we may run multiple models against our test set and compare the accuracy between these models.
In some software tool, types of miss-classification may be controlled, by weighing the importance of Type I and Type II errors, specified as ratios in negative integers, larger the negativity, the more damage.
Research Term
“LogWorth”: the negative log of the p-value, the larger (or smaller the p-value, the more significance), the more it explains the variation in Y, is used to select among candidate variables the one split variable, and the value at which it splits the population. It is calculated as the negative log of the p-value
Application Example
May be used to select the most significant factor that separate workforce either by gender or race, i.e. job group, job function, geographic location, annual salary, bonus or job performance ratings.
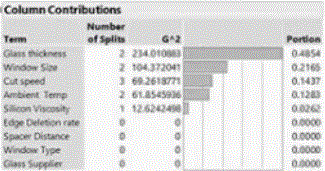
Screen to a few among a large number of factors to use in design of experiment, to avoid the large number of expensive full or fractional experiment runs.

(Modeling using JMP Partition, Bootstrap Forests and Boosted Trees)
