Data Analytics Skills that Accelerate Scientific Discovery (1)

The following main skills are essential for researchers and technology innovators:

  • Data summarizing knowledge
  • Uncertainty and quantification of uncertainty
  • Predictive models
  • Design and analysis of experimental data 

None of these are either trivial or easy. We will discuss in separate posts the above topics for practical application that will provide immediate benefits. Further study is always welcome such as through university courses or reading advanced texts. In each of the posts, we will first summarize the basic knowledge, then illustrate how this knowledge may be applied in the real world setting using one or multiple scientific and technological application examples.

1. Data Summarization Basics

Data Summarizing Knowledge is the basic skill for all data analysis methods. A good understanding of the data provides a foundation for locating the best method to tackle scientific and technological problems. To understand data, the first step would be to check on

  1. Types of the data (numerical, categorical, or  a mix of all)
  2. Structure of the data (a series, multiple series such as in a table, unstructured such as texts or images)

For numerical data, to summarize the data we need to focus on

  1. The center of the data (mean, median, mode, quantile)
  2. The variation of the data (variance, max, min, range)
  3. The distribution pattern (symmetric vs. tailed, the direction of skewness)

For categorical data, to summarize we need to check

  1. The frequencies or relative frequencies of each category

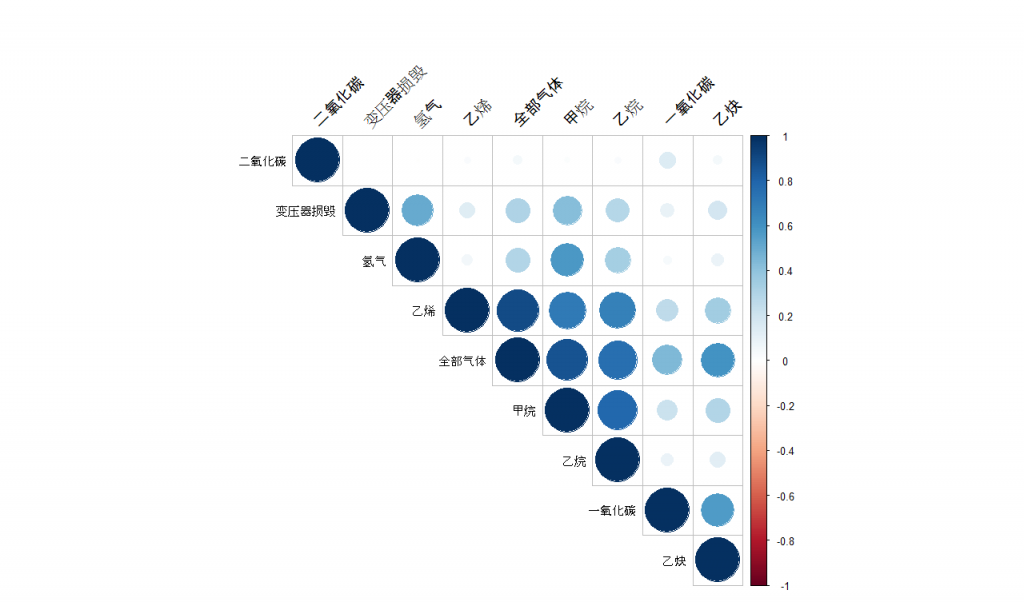
If the data contains multiple series such as those usually appear in a table, in addition to the above actions on each of the individual series we need to check the statistical relationships between the series (columns or variables in a table) as well. The most common statistical relationship is the linear correlation. A linear correlation exists between numerical series, between numerical and categorical series, between categorical and categorical series. More about that will be described later. A complete correlation matrix helps us understand which two series are closely related. Note this is just to gain very basic knowledge, there are many relationships that are hidden quite deep, we will need more advanced methods to discover, which we will introduce later. Linear correlation paints a direct picture of the association between the series. Often it tells us how these series are related.

通过维护电力变压器学习预防性维护方法(之一)

预防性维护是现代工业技术中一种高效的维护方法。借助历史数据和统计模型,可以快速辨别即将损坏的设备,可以大幅降低运营成本。借助开源R软件包,上手简单,方法易学,本文教你分快速入门。

关键词

统计模型,预防性维护方法,相关性距阵图,直方图,电力变压器,设备爆炸的预防,输电线网,供电线路稳定,现代工业加速器,故障概率,统计分析R软件。

一.

普普通通的电力变压器在输电线网中,将高压电降为低压电后传送到普通用户。但是如果不及时维修,它就会爆炸。这是为什么哪?在变压器内,里面装满了散热油。如果没有油,降压产生的巨大热量会让变压器立刻烧毁。但是在高压电环境下,油料会发生化学反应,生成甲烷,乙烷,乙烯,乙炔,氢气,一氧化碳等气体。当这些气体囤积到一定程度时就会引发爆炸。为了保证供电线路稳定,电力公司要在事故未发生时,及时地对变压器检修。 但是,要在成千上万的变压器中找到需要检修的并不容易,不是所有年龄到了的变压器就需要检修。现在我就给大家介绍一种现代工业维护加速器,预防性维护方法。

要研究就一定要有数据。 我们拿到了美国某大电力公司31,031台变压器的检修记录。这些数据记录了变压器的使用时间,是否发生过故障,故障的种类,以及变压器缸中气体的含量。现代仪器可以只提取一点改变压器内部的气体,快速分析出其中的各种气体含量。我们通过分析,要找出哪种气体,或者哪几种气体和变压器故障高度相关。我们还要估测故障概率是如何随时间,随每种气体的变化,而变化的。这可以帮助我们有选择地维修变压器, 而不是只按年龄维修。因为许多变压器即使年龄很高,但只要内部气体还没有达到一定的量,也没有损坏的风险的。

用开源统计分析R软件的“corrplot”包,我们可以很轻松的画一个直观的二位相关系数距阵图。具体的指令可见在结尾下载的R文件。

在这张相关性距阵图上,深蓝色表明正相关,深红色表明负相关。相关的一对变量分别标在对应的行和列上。我们首相应该注意的是与第二行“变压器是否损坏”相关比较高的变量。这几个分别是甲烷,氢气,乙烷和全部气体,也就是说,甲烷,氢气,乙烷和全部气体与变压器损毁正相关性较强。反之,乙烯,乙炔,一氧和二氧化碳含量与变压器是否损毁没有相关性。另外,在各种气体之间,我们也注意到比较高的正相关性。这个土可以很直观地揭示潜在的导致变压器损毁的气体

#################### Readin Rds data
Transformer <- readRDS("data/Transformer.RDS")
my_data <- Transformer[, c(6, 12:19)]

#################### Calculate and display the correlation in correlogram
par(mfrow=c(1,1))
res <- cor(my_data, use = "complete.obs")
corrplot(res, type = "upper", order = "hclust", tl.col = "black", tl.srt = 45)

下面我们再用直方图分析各种气体含量的分布。这里,我们比较一下各种气体含量在损坏变压器和完好变压器中分布的差异。如果哪种气体差异大,那么就说明这种气体可以帮助找到要出故障的变压器。这里红色的是出了故障的变压器,蓝色的是完好的变压器。我们另外画了拟合的密度线来帮助辨识。

#################### histograms of gas levles of transformers (Hydrogen only)
failure <- unlist(my_data %>% filter(Eventual_Failure == 1) %>% select(Hydrogen))
operational <- unlist(my_data %>% filter(Eventual_Failure == 0) %>% select(Hydrogen))

log_failure <- log(failure+2)
log_operational <- log(operational+2)

hist(log_operational, freq=FALSE, col='skyblue', border=F, xlim=c(0, 15), ylim=c(0, 0.4),
     ylab="密度", breaks=seq(0, 15, length.out=16),
     main = "", xlab="log(氢气)")
hist(log_failure, freq=FALSE, add=T, col=scales::alpha('red', 0.25), border=F, 
     breaks=seq(0, 15, length.out=16))
y1 <- density(log_operational, bw=0.7)
y2 <- density(log_failure, bw=0.7)
lines(y1, col = "blue", lty=2, lwd=2)
lines(y2, col = "red", lty=2, lwd=2)
title(main="氢气 (Hydrogen)")

浏览一下我们会发现,有几种气体差异还是比较大的。比如甲烷,发生故障的变压器甲烷含量多介于7-9之间,而完好的多介于0-5之间;又比如乙烷,损坏的变压器乙烷含量多介于5-9之间,而完好的基本小于5。氢气,乙炔和总气体也略微可以分出区别。而一氧化碳,二氧化碳,乙烯,乙炔好像区别不大。这样电力公司只要测量一下甲烷,乙烷,氢气的含量,就可以大概知道变压器是否需要维修了。比如甲烷,如果含量在7-9之间,就应该维修。如果是乙烷,在5-7之间就应该检修了。

总结

但是这样做比较笼统,不够精确。比如,有的变压器即使甲烷含量比较高但依然可以正常工作,乙烷大于5也没有损坏。相反,不少变压器还没有达到某气体的危险程度就已经坏了。有一个重要因素我们还没有考虑进去,这就是变压器本身的使用年龄。在接下来的视频中,我们将介绍如何通过一个统计模型,同时使用年龄和各种气体含量,来更准确地估测设备的故障概率。

Design of Experiment (DOE) Response Surface Methods (RSM) to Optimize Wafer MOSFET Polysilicon Gate Etching Production with R in 10 Minutes

In integrated circuit (IC) manufacturing, engineers need to ensure the polycrystalline lines on the wafer are perfectly straight up. There are millions and millions of these tiny lines with a square millimeter area, and these billion lines are created together in a plasma chamber. Today we will introduce an experiment method to find the best equipment settings, the method of Response Surface.

Reactive-ion etching (RIE) is a microchip silicon wafer etching technology in chip fabrication. It uses chemically reactive plasma to remove patterned silicon dioxide “film” deposited on wafers. The plasma is generated under a low-pressure vacuum by Radio Frequency electromagnetic field, with chemical gas vapor injected in. The right combination of Radio Frequency (RF) electric field power, the pressure of the vacuum, and hydrogen bromide (HBr) gas injected into the etch chamber are the key factors lead to the quality silicon wafer. Engineers will need to ensure the profile of the polycrystalline silicon gates isotopic, that is, the walls of the etch lines should be vertically perpendicular to the substrate in all directions.

In this study, the engineers would like to find the right processing settings for this etching equipment. As this is a million-dollar business, we are going to help them, using design of experiment methods.

Data and sample R commends (user needs to load data to R)

View the video